R-390A / SoftRock SDR Combination

R-390A / SoftRock

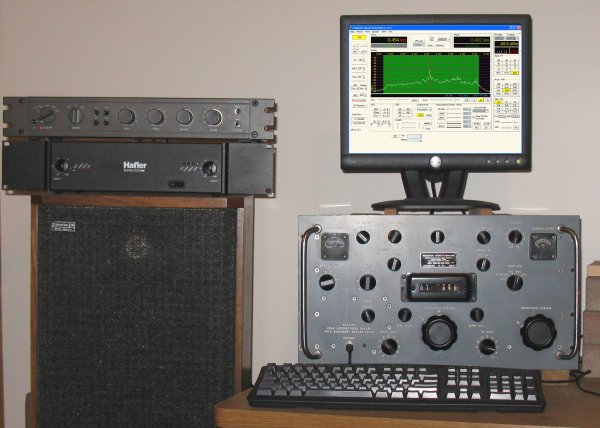
The R-390A / SoftRock setup has generated quite a bit of interest and a number of questions on the setup since first appearing on the AMfone website. This page is a collection of information that has appeared in various threads on AMfone plus additional measurements I've made on the R-390A alone and with the SoftRock SDR. The information presented here should be applicable to other receivers and other i-f frequencies with appropriate changes.

The basic concept is to use the R-390A as a high performance 'front end' for a software defined radio (SDR) i-f receiver. An R-390A provides the rf amplifiers, tracking filters, mixers, HFO, VFO, wide i-f filter and i-f amplifier stages and the SoftRock SDR setup takes over from there providing the final i-f filter bandwidth, detectors, AGC (if desired) and low level audio. The R-390A is tuned to frequency as normal, however control of the final i-f filter bandwidth, detector type, volume control, etc is done 'on screen' under the control of software. The software of choice seems to be FlexRadio PowerSDR, although other software can also be used.

Advantages of this 'old meets new' mix of technology are many. The R-390A offers robust rf performance, rock solid frequency stability, exceptionally clean HFO and VFO mixer injection, a wide 16 kHz mechanical filter and a superbly wide linear operating range throughout the rf and i-f stages. The SoftRock SDR and PowerSDR software build on this with preset and user defined 'brick wall' filters that can be easily repositioned in the passband. A number of different detectors are available including USB, LSB, DSB, AM, Synchronous AM, FM plus several for digital modes. The software can provide AGC if desired. Display choices include spectrum, panadapter, scope, phase, waterfall and histogram. One can record .wav files conveniently from the main screen. Numerous other features are available.

In addition to excellent MDS, blocking and two-tone dynamic range performance, tests have shown that AM audio S/N, audio frequency response and audio distortion for the R-390A / SoftRock / Power SDR software combination to be extremely impressive.

Basic Setup

R-390A / SoftRock Block Diagram

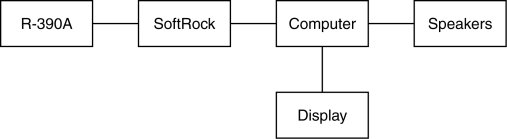
Output from the R-390A is taken at the 455 kHz i-f output port on the rear panel of the receiver. The 455 kHz SoftRock receiver is used to down convert* the 455 kHz i-f to roughly 10 kHz - suitable for application to the computer sound card. A computer does the 'heavy lifting' running the software that provides the various filter bandwidths, detectors, AGC, spectrum and panadapter displays and other interesting features. The computer sound card is used to drive an audio system or a set of computer speakers. Minimum computer requirement for decent performance is a 1 GHz machine with 512 ram.

Using the R-390A internal AGC simplifies the setup as there will be less system variables to consider. The typical maximum output level from the i-f output port of an R-390A, with AGC on and rf gain control at 10, is about -15 dBm and can be applied directly to the SoftRock. Once everything is cabled together it's a simple matter of installing and running the FlexRadio PowerSDR software. On initial startup, the software will ask a few setup questions then you're ready to hit the 'start' button. A few quick adjustments and the system should be good to go. Use the R-390A in the 16 kHz bandwidth position with agc on and the rf gain control full clockwise.

As a starting point for the PowerSDR software:

AF: 50
AGC-T: 30
AGC: Fixd
Preamp: High
Display mode: Panadapter, AVG button depressed
Zoom: 2X
Mode: User select (AM)
Filter: User select (8 kHz)

From the menu bar select Setup > Hardware Configuration and under Radio Model select the Soft Rock 40 button. Under SoftRock Options enter a Center Freq (MHz) that corresponds to the 455 kHz i-f minus the associated output frequency of the SoftRock (generally 10 - 11 kHz). If you're unsure of the exact output frequency subtract 10 kHz - this can can be adjusted later using a known frequency. In this case it would be 455 - 10 = 445 kHz or 0.445 MHz. Press Apply and Okay to return to the main screen. Use the mouse to drag the black area of the panadapter display so that 455 kHz is centered on the display.

Assuming that your R-390A tuning dial and crystal calibrator are in alignment, tune to an even 100 kHz mark and turn on the crystal calibrator. A tall 'pip' should be seen on screen. If it isn't exactly centered on 455 kHz readjust the Center Freq (MHz) set in the paragraph above until the 'pip' is right on 455 kHz. The difference between 455 kHz and the new Center Freq (MHz) setting should be noted as xx kHz. The display can now be used to show the actual operating frequency, instead of the i-f, by entering the received frequency - xx kHz for Center Freq (MHz). For example 3.885 - .010 = 3.875 MHz. This sounds more confusing than it actually is!

Beyond this, there are a number of settings that one might want to adjust. If you're computer and soundcard is up to the task, select Setup > Audio and adjust Buffer Size to 2048 and Sample Rate to 96000. One should review the PowerSDR documentation in order to understand and get the most out of the software. The settings discussed here are only a first step to get up and running.

The basic setup has a few limitations that should be noted. Since the system uses the R-390A AGC, the i-f signal applied to the Softrock and PowerSDR software is AGC levelled by the R-390A. This means the PowerSDR software S meter does not display an accurate received signal level and the panadapter screen has limited dynamic range. Also, with the R-390A controlling the AGC the AM audio distortion at low audio frequencies suffers from increased distortion. These limitation can be overcome by operating the R-390A under manual gain control (MGC) with AGC duties handled by the software.


Enhanced Setup

R-390A / SoftRock

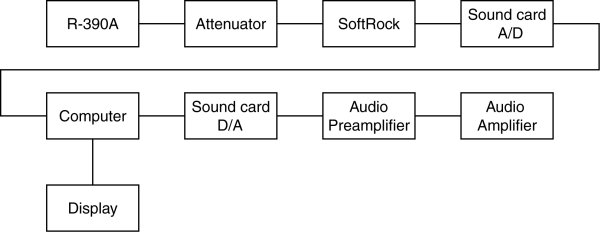
An enhanced setup offers a number of system improvements, including accurate S-meter readings, a much wider panadapter screen dynamic range and cleaner demodulated AM output by operating the R-390A in manual gain control (MGC) mode. A faster computer - one in the 2+ GHz range with 1G ram offers improvement as does a better sound card. By switching from a Soundblaster Live 5.1 to an M Audio Delta 44 sound card and breakout box, the system gained over 10 dB of dynamic range. Most of the gain came at the 'weak signal' end of things - apparently the Delta 44 is significantly quieter. A high performance audio preamplifier, power amplifier and good speakers offer additional improvements. In the system described here a Hafler DH-110 preamplifier, Hafler P3000 power amplifier and studio monitor speakers were pressed into service.

Some system considerations are necessary when operating the R-390A in MGC mode as the receiver can output +16 dBm at 455 kHz at the rear panel i-f port. This level is more than sufficient to overload the SoftRock receiver and must be attenuated. To determine the amount of attenuation required one needs to first study the R-390A 455 kHz i-f output level vs. rf input levels and settings of the manual gain control.

The following table was created using an HP8640B as a signal source into the antenna terminal of the R-390A.

Receiver input levelAGC 10MGC 7MGC 8MGC 8.5MGC 9MGC 10
 
-113 dBm-43 dBm-85 dBm-71 dBm-62 dBm-37 dBm
-103 dBm (S4)-38 dBm-75 dBm-61 dBm-52 dBm-27 dBm
  -93 dBm-35 dBm-65 dBm-51 dBm-42 dBm-18 dBm
  -83 dBm-31 dBm-56 dBm-41 dBm-32 dBm  -8 dBm
  -73 dBm (S9)-29 dBm-45 dBm-31 dBm-22 dBm  +3 dBm
  -63 dBm (S9 +10)-27 dBm-34 dBm-21 dBm-11 dBm+10 dBm
  -53 dBm (S9 +20)-26 dBm-78 dBm-24 dBm-11 dBm  -1 dBm+15 dBm
  -43 dBm (S9 +30)-26 dBm-68 dBm-14 dBm  -1 dBm  +8 dBm
  -33 dBm (S9 +40)-25 dBm-58 dBm  -4 dBm  +9 dBm+12 dBm
  -23 dBm (S9 +50)-24 dBm-48 dBm+ 7 dBm+12 dBm+16 dBm
  -13 dBm (S9 +60)-22 dBm-32 dBm+12 dBm+16 dBm
    -3 dBm (S9 +70) -22 dBm  -2 dBm+16 dBm

The column on the left is signal generator input level to the receiver antenna terminal and the columns to the right show the associated i-f output at the rear panel port. AGC 10 is with the receiver AGC on and the rf gain control at the 10 position. To the right are measurements using manual gain control (MGC) with various settings of the rf gain control. Values in red indicate that the i-f output is in gain compression and at that point and the i-f output will no longer linearly follow the rf input. One should probably measure their own receiver to know for sure but measurements on two receivers show them to be reasonably close in performance.

Picking the best setting is pretty obvious. MGC 7 provides too weak a signal to take advantage of the SoftRock dynamic range and MGC 10 shows gain compression occuring at just over -73 dBm or S9 signal level. Neither of these settings would be appropriate. MGC 8.5 provides a very wide dynamic range and is linear for signals up to S9+40 dB.

It's interesting to note just how wide a linear dynamic range is available without AGC. The chart above was not extended to weaker input signal levels but the receiver is easily capable of hearing -139 dBm signals (or better). That's another 26 dB below the -113 dBm input signal shown. That brings the total R-390A linear dynamic range, without agc, to about 106 dB. That's a very impressive number probably not equalled by many other receivers.

Now that the maximum linear i-f output level has been established at +9 dBm (for MGC 8.5) the system gain distribution can be analyzed.

R-390A / SoftRock

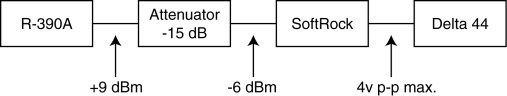
Starting at the output and working forward, the maximum that the Softrock can output (with a little headroom) before clipping is 4V p-p. The input level to the SoftRock that generates the 4V p-p output is -6 dBm. This means that an attenuator of 15 dB is required to reduce the maximum +9 dBm R-390A i-f output to -6 dBm input level of the SoftRock. (One could, instead, modify the SoftRock for less gain but an attenuator is simple to build and provides an excellent termination for both the R-390A i-f and SoftRock input transformer/filter).

To calibrate the system an accurate S9, (50 uV, -73 dBm) is applied to the R-390A rf input. With the 15 dB attenuator still in line select the PowerSDR 'Preamp' setting that makes the s meter read closest to S9 (-73 dBm). Adjust the R-390A rf gain control for an s meter reading of exactly S9 (-73 dBm). A slight adjustment of the R-390A gain control makes a big change. Getting the meter to read within a few tenths of a dB is more than close enough. Note the rf gain control setting.

What does one do with signals bigger than S9 +40 dB? In those cases one can operate 'uncalibrated' by turning down the rf gain control to keep signals levels below S9 +40 dB on the meter. Another possibility is to use an rf step attenuator ahead of the receiver and click in 10 or 20 dB of attenuation as needed. The amount of attenuation is added to the displayed signal level on PowerSDR for an accurate reading. Note that the R-390A internal s meter does not function in MGC mode.

While the R-390A is a pretty robust receiver, keep in mind that its two-tone IMD dynamic range is less than the 100 dB on screen display. Multiple strong signals within the passband may produce IMD products that are visible and should not be attributed to the transmitters.

The following screen shows what one can expect from the panadapter display used in the method outlined above. The receiver happened to be tuned to 1885 kHz when this shot was taken. The green area in the display represents the filter bandwidth in use - 8 kHz in this case. This area changes as different filter bandwidths are selected or can be resized and repositioned by dragging it with the mouse. Almost any filter bandwidth or relative position can be accommodated. Once an interfering signal is outside the 'green zone' its gone...thanks to the brick wall filters.

R-390A / SoftRock

Click on image for larger version.


The 'band noise' can be seen at about -100 dBm - roughly equivalent to S4. The 'pip' near the center of the screen is the carrier of the desired AM signal. In this case, it's slightly above 1885 kHz and has a signal level of about -60 dBm, S9 +10 dB plus a little. The signal just above 1892 kHz is another carrier that's about 5 dB stronger than the desired signal. Since it's outside the 'green zone' it can't be heard. At just below 1878 kHz there's an SSB signal at about -85 dBm at that point in his modulation envelope. Again, he's well outside the 'green zone'. In this case a 12 kHz wide filter could be selected and the two interfering signals would not be heard.

The band noise drops off near the edges of the display due to the R-390A 16 kHz i-f filter limiting the bandwidth. Removing the antenna drops the band noise, as expected, to a level below -130 dBm.

The following PowerSDR screen shows the R-390A/SoftRock operating as outlined in the preceding paragraph. The signal shown was generated by an external crystal oscillator and shows the 100 dB on screen dynamic range. Also note the extremely low phase noise of the R-390A - certainly one of the cleanest receivers around.
R-390A / SoftRock

Click on image for larger version.


A separate web page covers the R-390A MDS, blocking and two-tone dynamic range measurements, as well as AM audio S/N, frequency response and distortion measurements. Info can be found at R-390A / SoftRock SDR Performance Test

.

Notes:

* Although the SoftRock provides both I and Q outputs, only one output is required in this application since the output from the R-390A is taken after the 16 kHz i-f filter and there is no i-f image present. As Stu AB2EZ has pointed out, the SoftRock can be replaced with a simple oscillator and mixer assembly. If going that route, investigate the third order distortion of the mixer carefully - especially if plans include operating in 'enhanced' mode with a 100 dB wide dynamic range display. One advantage of the Softrock is the essentially spurious free output when operated below output saturation.


Jay Rusgrove W1VD


Back to W1VD home page