|
Minimum discernible signal (MDS) is the signal level required at the receiver input to produce an output that is 3 dB above the noise. Measurements are normally made in a cw bandwidth (400 - 600 Hz if available) with the aid of a calibrated audio voltmeter. The larger the negative number the weaker the signal and the better the receiver sensitivity. Since there is greater atmospheric noise at the lower frequencies the importance of this number changes with the frequency. For example, a receiver with an MDS of -123 dBm might be sensitive enough for the lower bands (160, 80 and 40 meters) with a reasonable sized antenna but would be considered deaf on the higher bands (20, 15 and 10 meters). A good all around number would be roughly -136 dBm or better.
Blocking dynamic range is a measure of receiver densitization by a strong signal outside the desired receiver passband. The receiver is tuned to a relatively weak signal (-110 dBm) and an interfering signal 20 kHz away is increased in signal strength until the desired signal is decreased by 1 dB as indicated on the calibrated audio voltmeter. The level of the interfering signal is then referenced to the noise floor and this gives the blocking dynamic range - above the noise floor. The higher the number the better. Good receivers typically test in the 110 dB range although excellent receivers can do much better.
Two tone dynamic range is a measure of receiver third order distortion. This occurs when two strong signals combine in vulnerable receiver stages and 'phantom' products are generated according to (2*f1-f2) and (2*f2-f1). To measure this, two signal generators are set for frequencies 20 kHz apart and are kept at the same output level. The generator levels are increased to the point where the third order products rise above the noise by 3 dB as indicated on the audio meter. The level of signal generator output is then referenced to the noise floor and this gives the two tone dynamic range - above the noise floor. Again, the higher the number the better. Good receivers typically test in the mid to high 80 dB range although excellent receivers test much better.
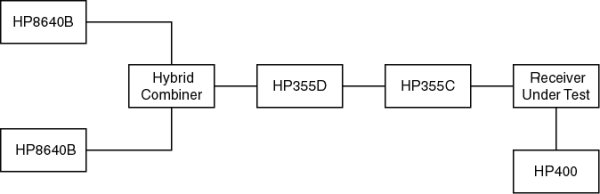
The receiver measurement setup is shown below. Two HP8640B signal generators are combined and applied to the attenuators. The first attenuator range is 0 - 120 dB in 10 dB steps and the second attenuator is a 0 - 12 dB in 1 dB steps. Output from the attenuators is applied to the receiver antenna connection and the audio output is monitored with an rms voltmeter.
|
|
|
|
An interesting addition to any receiving setup is a front end step attenuator. Especially on the low bands, most receivers have sensitivity that is much better than required. One can typically 'click in' 10 or 20 dB of attenuation and still hear the band 'background' noise. While this doesn't increase the receiver dynamic range it does shift it to higher power levels. With this technique even a poor receiver can be made to perform admirably. The s meter will read low by the amount of attenuation so make sure to add that in when handing out signal reports!
The next series of measurements should be of particular interest to AMers.
AM audio S/N is a measure of the receivers ability to recover audio from the AM carrier compared to the residual noise of the receiver. For this test a 1000 uV rf signal, modulated at 30% by a 1000 Hz tone, is injected into the receiver and the level of the recovered audio is measured by the audio voltmeter. The modulation is then removed from the carrier and the new audio output reading is subtracted from the previously noted level. Higher numbers are better and good receivers test in the mid 40s or better.
AM audio frequency response measures the receivers ability to demodulate the audio spectrum applied to the AM carrier. This response is primarily determined by the i-f bandwidth although the audio amplifier may also be a limiting factor. For this test the same 1000 uV rf signal, modulated at 30% is used, however the audio frequency is stepped through the range of 100 Hz - 6 kHz. The initial reading is taken at 1000 Hz and this is used as the 0 dB reference for the remainder of the readings. The widest receiver i-f bandwidth is used for this test. If the receiver is equipped with a tone control it is set for the flattest possible audio response before the test is run. There really is no 'good' or 'bad' rating for a receiver in this test as the high frequency attenuation is due to the available i-f bandwidth. Low frequency roll off is normally caused by limitations in the audio amplifier - sometimes by design.
AM audio distortion (THD) is a measure of the receivers ability to cleanly demodulate the audio applied to the carrier. For this test the same 1000 uV rf signal is used, however the modulation percentage is adjusted for 30, 50, 70, 90 and 100% and audio frequencies are stepped through the range from 100 Hz - 2 kHz. Lower distorion is obviously better. By keeping the receiver audio ouput level low, the main cause of distorion will be the AM detector although poor AGC filtering can raise the distortion at the low frequencies. Check out the National HRO-60 test results that show a reduction in low frequency distortion with a simple modification to the AGC.
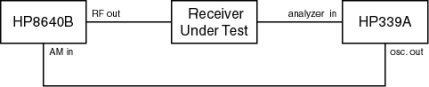
The audio measurement test setup is shown below. The precision audio oscillator output from the HP339A distortion analyzer is used to AM modulate the HP8640B. Audio output from the receiver under test is then evaluated by the HP339A.
|
|
|
|
|
|
| |